EPR
In general, EPR may provide following information:
- Chemical structure of the unpaired e- center (where is the unpaired electron “located”, what is the reactive site of the molecule or which substituents are close to the center).
- Concentration/number of paramagnetic species in the sample. The EPR is more sensitive than NMR and the detection limit for the instrument installed at IOCB is ≈ 10-7–10-8 mol.dm-3.
Dynamics of the unpaired e- center, e.g. rotational correlation times of nitroxide spin labels.
Solid-state (powders or frozen solutions) as well liquid samples may be investigated by EPR within the temperature range of ≈ 80–500 K
EPR Tubes & cells
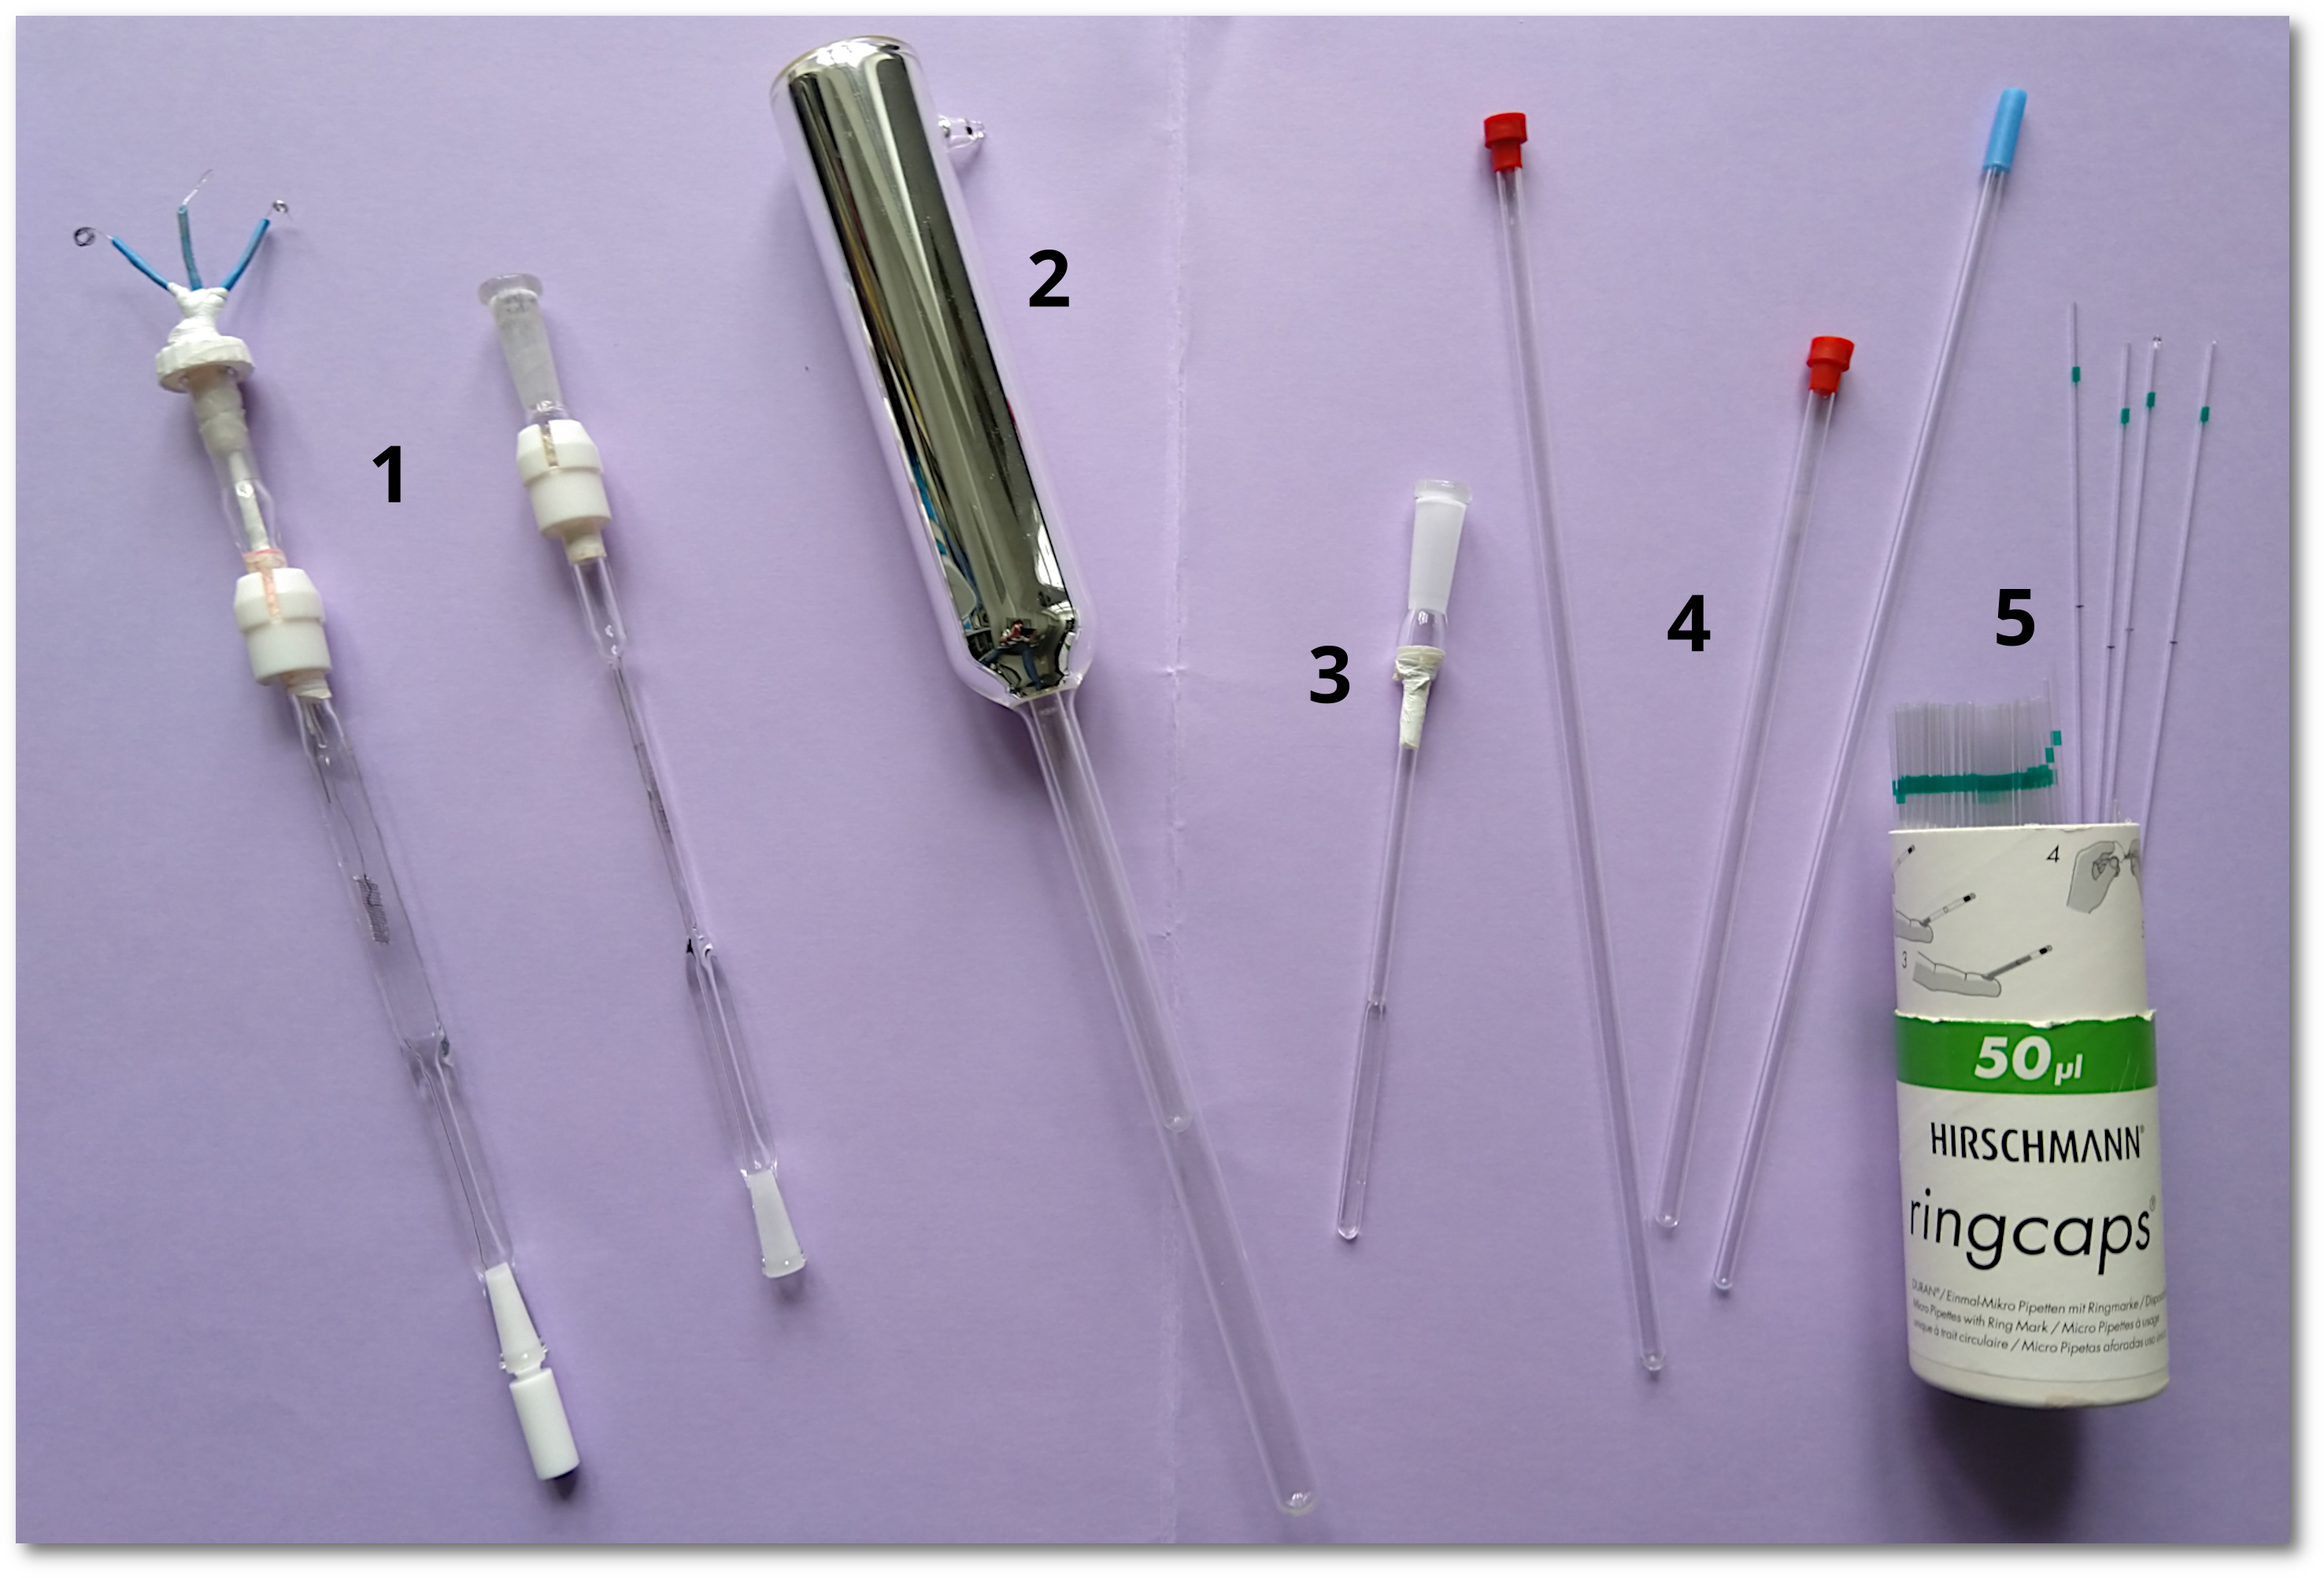
Tubes/cells for EPR and NMR spectroscopy cannot be interchanged! Please ask the EPR spectrometer operator to provide the most suitable cell. In case of liquid samples the solvent polarity is important because solutions in polar/non-polar solvents are investigated in different types of cells (see the figure below).
|
Tubes/cells for different EPR experiments:
1. Flat-quartz-cells for RT and polar/non-polar solvents (e.g. for EPR spectroelectrochemistry) 2. “Finger-dewar” to measure frozen solutions in liquid N2 3. Small flat-quartz-cell for VT experiments (polar/non-polar solvents can be used) 4. Common quartz-EPR cells for only non-polar solvents at RT 5. Glass capillaries for polar/non-polar solvents to measure organic radical solutions at RT |
Sample amount/concentration
Solid samples
Powder samples should be homogenized with the minimal weight of ≈ 3–5 mg. If quantitative EPR analysis is required then larger amount (at least 10 mg) has to be provided.
Liquid samples
Due to the higher EPR sensitivity, lower analyte concentrations than in NMR are used. The most common concentrations fall into the range of ≈ 10-4–10-3 mol.dm-3. However, it may depend on the radical/paramagnetic center stability/reactivity. For instance, highly reactive (transient) radicals (e.g. ·OH) cannot be detected within the common EPR time-scale of seconds to minutes. Therefore, additional technique called spin trapping might be necessary to study such kind of radicals (see below).
The EPR is limited by the upper concentration range of ≈ 0.05–0.1 mol.dm-3 due to the higher probability of spin-spin exchange, which may cause extensive line-broadening of the EPR spectra. Typical volumes of the analyte solution for one EPR measurement are 40–700 µL.
Advanced EPR methods
Spin trapping
Any transient radical which cannot be investigated within the common EPR time-scale may be detected as a secondary radical upon reaction with non-radical (diamagnetic) compound called spin trap according to general scheme presented on the figure below.
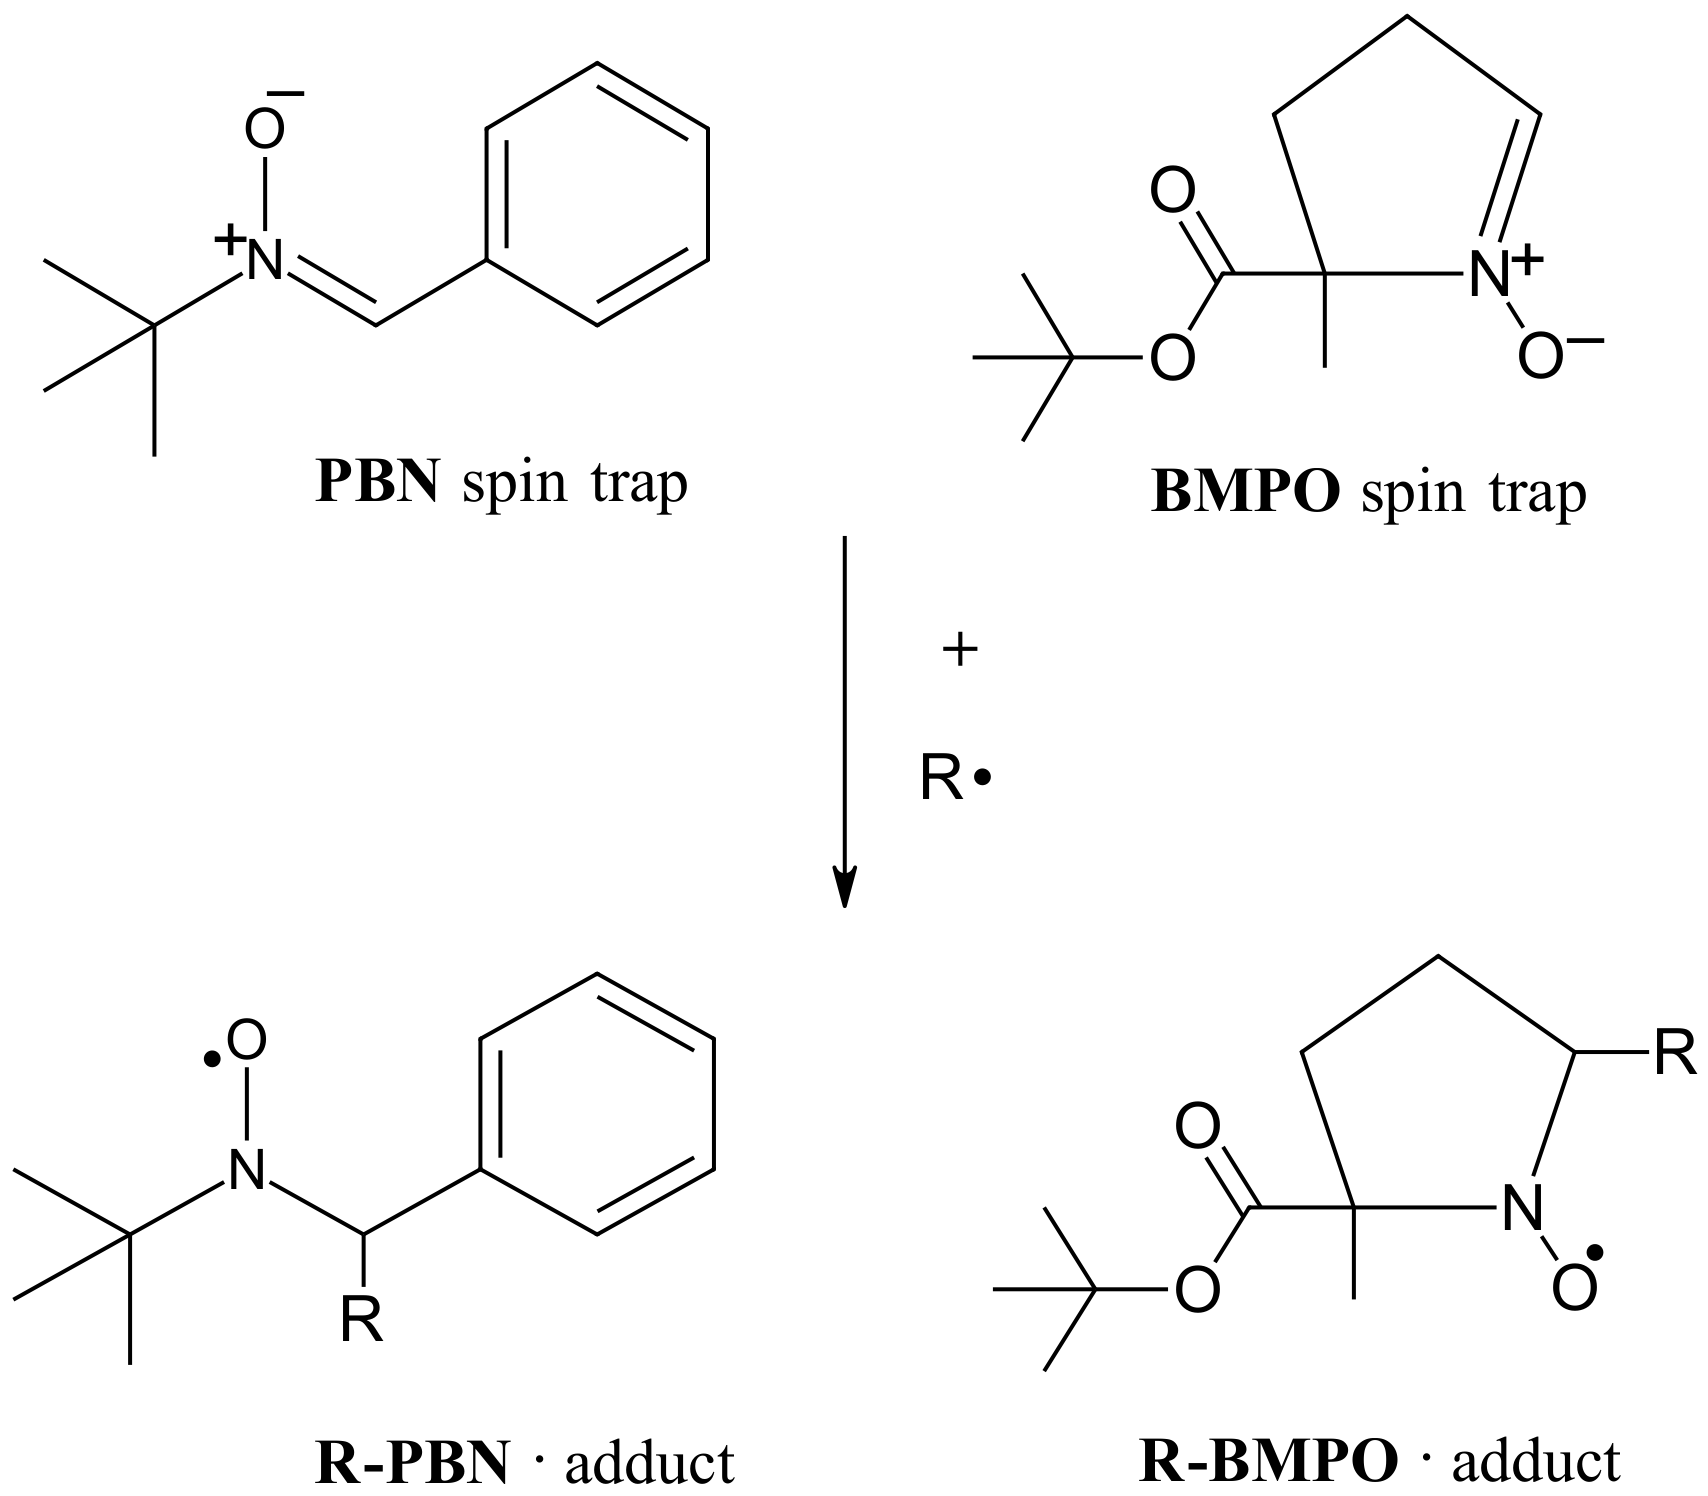
Scheme of the spin trapping reaction: PBN trap can be used for e.g. carbon-/nitrogen-centered radicals, while the BMPO
is usually applied for oxygen-centered radicals (e.g. ·OH).
Two stable (long-term storage at -19 °C) spin trap agents are available in the EPR lab: N-tert-butyl-?-phenylnitrone (PBN) and 5-tert-butoxycarbonyl-5-methyl-1-pyrroline-N-oxide (BMPO). However, additional spin traps, depending on primary radical type and its reactivity may be considered as well. The trapping compound must be always present in excess to primary transient radicals in order to undergo stochiometric reaction with those radicals.
In situ irradiation and EPR spectroelectrochemistry
Radicals, radical ions or paramagnetic oxidation states of metal coordination compounds are often investigated in complex redox or photochemical reaction pathways. For such purpose the EPR spectrometer enables in situ irradiation (by sources with ?max ? 350 nm) of the sample as well as controlling the progress of a redox reaction by a 3-electrode system and a potentiostat (Ivium Technologies). Both techniques may run directly in the EPR probehead and the EPR spectra can be recorded simultaneously either during the continuous irradiation or during the electrochemical/voltammetric experiment.
As an example, the following figure shows electrochemical oxidation of bis(ethylenedithio)tetrathiafulvalene (BEDT-TTF) and the EPR responses/signals (+ corresponding double integrals) obtained during the in situ experiment upon oxidation. Such analysis unambiguously confirms two-step oxidation of BEDT-TTF:
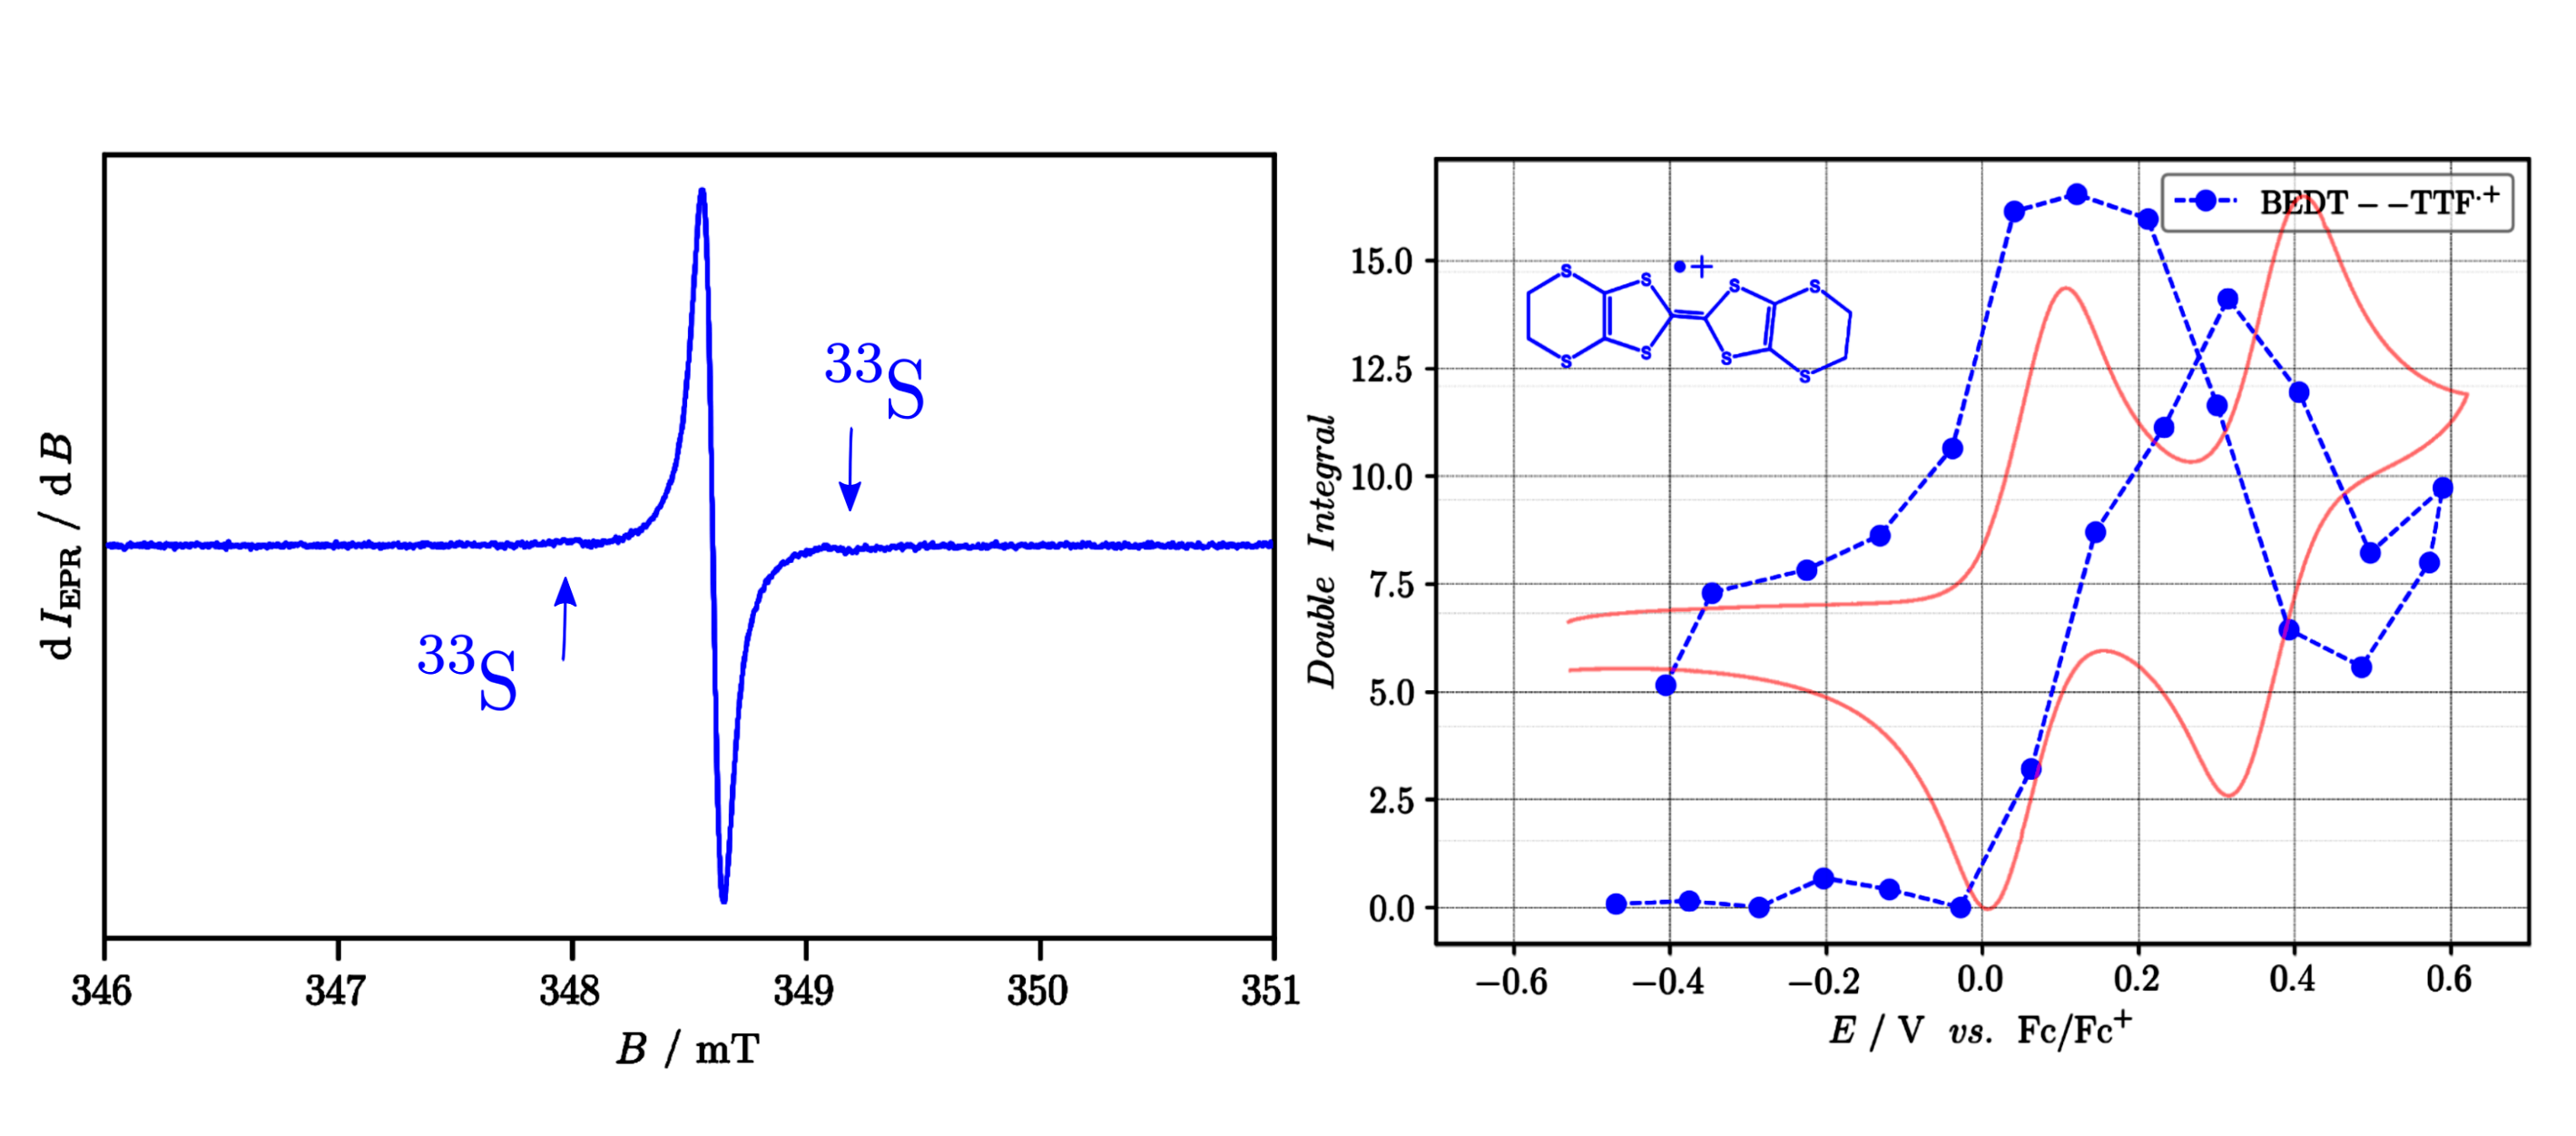
Left: An EPR spectrum recorded during the voltammetric oxidation scan (red curve in the right figure) of BEDT-TTF. The arrows denote satellites coming
from 33S interactions with unpaired electron of the radical cation.
Right: Blue dashed curve represents double integral of the EPR signal to show in which potential range the radical cation is formed and in which its concentration decreases.
Continuous-wave ENDOR spectroscopy
ENDOR stands for Electron-Nuclear DOuble Resonance spectroscopy. The technique might be regarded as an analogy to heteronuclear NOE (Nuclear Overhauser Effect method) in NMR. The basic principle consists in saturation of selected electronic spin magnetic transition, while scanning radio-frequencies (usually from ?RF = 2–100 MHz) at which changes in the EPR intensities are observed. Couplings between the unpaired electron and the neighboring nuclei are much stronger than between two nuclei in NMR. Therefore, the corresponding frequencies/coupling constants are also much higher and fall into the order of MHz. The ENDOR supplies detailed and unambiguous information about the nuclei, which are present in the vicinity of the unpaired electronic center. This technique therefore offers structural evidence of the paramagnetic center that cannot be evaluated by common analysis of EPR spectra. However, it is experimentally demanding and it often requires measurements at different temperatures and solvent viscosities.